

Mac OS X Mavericks still has many of the same applications already used in Mountain Lion. Some have had major overhauls, whereas others have just had minor tweaks in functionality or appearance. One of the most useful applications built into Mac OS X is Activity Monitor, as it shows how your Mac is performing and the status of various processes and apps that may be running. It can be an incredibly useful tool, especially when your Mac slows down, as it lets you see if you’re running low on memory and identify and processes that might be consuming too much CPU resource. Activity Monitor also allows you to inspect every process running, and terminate them if necessary.
Here’s a quick run down of the features of Activity Monitor, with some highlights of the latest version in Mavericks.
Activity Monitor Features
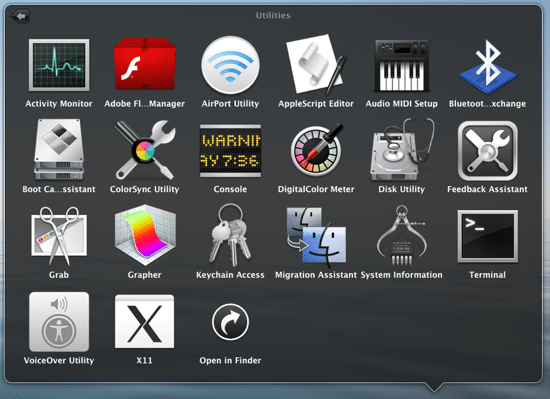
Top open Activity Monitor, just type its name into Spotlight and the application should be shown in the results. Otherwise, it can be found in your Applications folder under Utilities. Just click on the icon to open.
The first thing you’ll notice is a list of all the processes running, along with various options at the top:
- CPU
- Memory
- Energy
- Disk
- Network
CPU
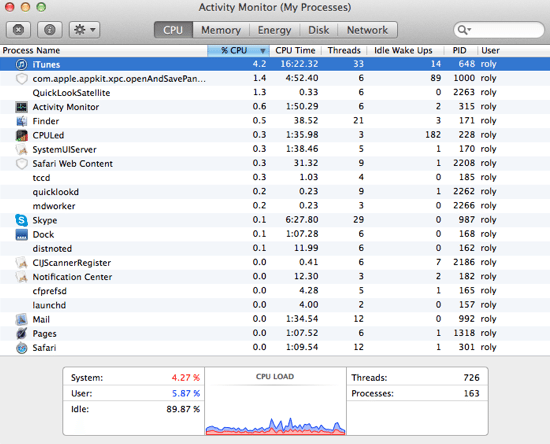
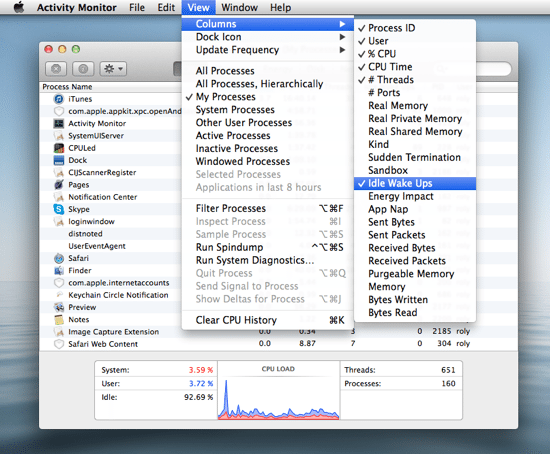
Click on the CPU button to see details about your Mac’s processing activities. By default, there are 7 columns shown – such as the Process Name, %CPU used and time, number of threads, idle wake ups, the process ID and the user that is running that process. Note that it’s possible to add more columns to this particular view – just select View -> Columns from the menu and choose which columns you want to see – the entire list is displayed and it can be customised any way you like.
It can also be useful to change the view to show processed hierarchically – that is, organised by application and every sub-process. From the View menu choose All processes, hierarchically. Now you can expand each one (using the little grey arrow next to the application name) to view more details about every process used by every application.
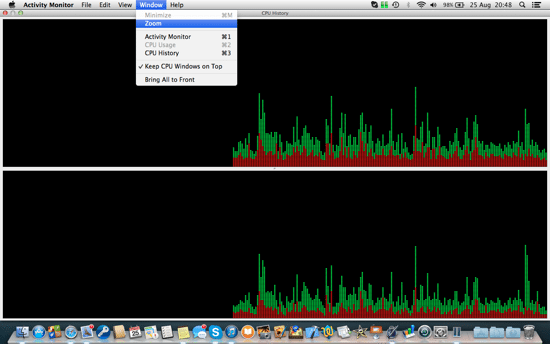
There is also a nice CPU usage window (accessibly from Window -> CPU History) that launches a mini window that shows the activity of each CPU core. Even if you close the Activity Monitor window (but not Quit), you can keep this little window open to monitor the workload on your Mac. If you then click Zoom from the Window menu, you can see a fullscreen version of the CPU History window.
In terms of Mavericks, there’s not really that much new in the CPU section, but it does give you the ability to see how loaded your system is.
Memory
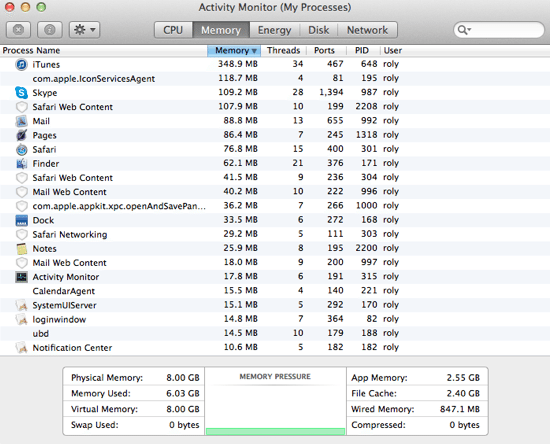
The memory section quickly lets you see what applications are consuming the most memory – you can order the Memory column in ascending or descending order. This section of Activity Monitor has a few new features, such as a nice summary at the bottom which shows all the different categories of memory (physical, virtual, app memory used and file cache size). The most notable feature is perhaps the new concept of “memory pressure” which is a chart that shows just how much strain the system is in, in terms of memory use. If you have limited memory and your Mac is continually using virtual memory (hard disk space it treats as RAM), then this graph will clearly show that.
There is also the new “compressed memory” heading – basically when your Mac is running out of memory, it will compress some of that memory thus freeing up some of the space to use for other processes. This is a completely new Mavericks feature and can really help to speed things up and keep everything snappy.
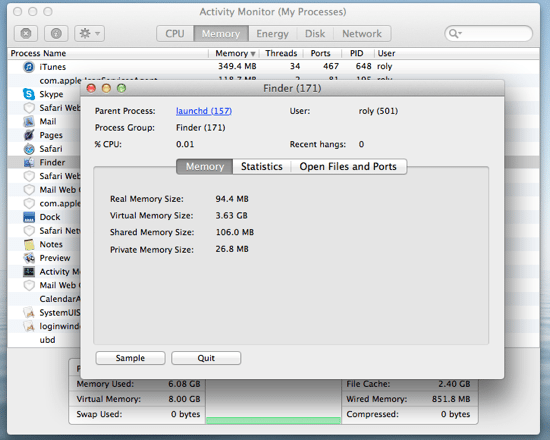
If you double click any process from the Process Name list, it will open a window that shows more details about that process (or just click the “i” button on the window), as well as more details about memory usage, some general statistics such as CPU %, and a list of open files and ports.
Energy
In Mavericks, Activity Monitor has gained a new Energy section. With increased focus on saving energy (and thus extending battery life), Mavericks really helps you find out which applications and processes are using the most energy. This tab shows you energy used over the last 8 hours or so, as well as which apps are “napping” – this is a unique new feature that is designed to put apps to sleep for periods of time when they do not need to run. Applications such as Safari don’t really need to be doing much when they are not visible – recall the great demo in the last Apple keynote that showed Safari having a nap when another window covered it?
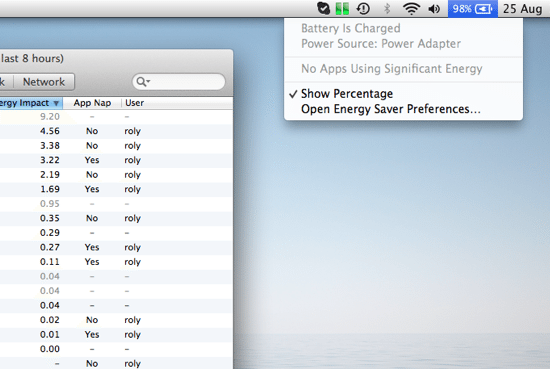
There’s also a handy little feature that shows the energy impact of those using significant energy, accessible from the battery/power status icon in the menu bar. Just click on your battery icon to view the information – any apps using significant energy will be shown here. Likewise, if all apps are using nominal energy, this will be shown in the menu.
Disk
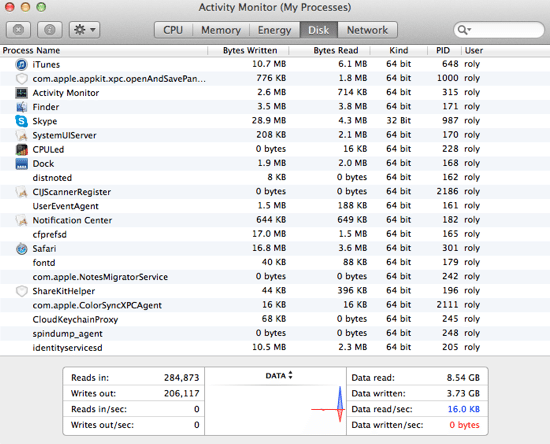
The Disk tab shows items related to disk uses, such as the number of bytes written and read by each application. There’s nothing really new here, but this section does allow you to pinpoint any applications reading a lot of data, such as Skype or Safari. The graph can be made to show Data or IO, using the drop down arrows above the chart.
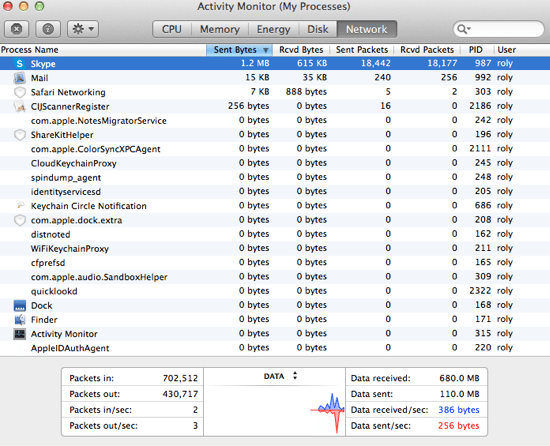
Network
The Network tab predictably shows everything you might want to know about network usage per application, such as the bytes (or packets) sent and received. The graph at the bottom shows a general view for everything (sent and received), whereas the columns show detailed information for each process or application.
Dock Icon
There is a lot more than Activity Monitor than those items mentioned above. For example, you can set its Dock icon to show CPU usage or history, by selecting View -> Dock Icon and choose from the list.
It can be useful for example to show the CPU activity, if you don’t already have a separate application installed that does exactly that. One curious omission in Mavericks (that was present in Mountain Lion) is the ability to show the memory usage pie chart as the Dock icon – perhaps this will be reinstated in the final version.
Update Frequency
It’s all very well having all this information at your fingertips, however the standard update frequency of the graphs and columns is rather too slow for my liking. You can increase the update frequency from the View -> Update Frequency menu and choose Normally (5 sec), Often (2 sec), or Very often (1 sec). Setting it to Very often will of course use a bit more CPU, but it should be negligible. In fact, you can even scroll through the list and see how much resources Activity Monitor itself is using!
Miscellaneous Features
Activity Monitor is also a useful tool if you want to terminate a process – just click the “X” button on the main window to kill a process (force it to quit). A warning dialog box will pop up asking whether you want to confirm. There’s not really any difference killing a process this way rather than using Cmd + Alt + Esc, however you can do it at the process level, rather than the application level.
If you want to run system diagnostics on your Mac (to check whether everything is working properly) – you can do that here from the View menu and select Run Diagnostics. You might be prompted to enter the administration password. When the procedure has finished you’ll see a Finder window called tmp that contains a GZIP archive file. Upon opening that file, you’ll see a folder containing all kinds of diagnostics information in dozens of files – not really that useful to most people, but if you’re having serious computer problems this is just the kind of information that you could use to send to Apple. However, you might be able to glean something useful from these files (especially if you are technically-minded) – for example, the file called disks.txt shows you disk information like the amount of free space, whereas error_log.txt shows information about any errors that have occurred.
All in all, it’s worth playing around with Activity Monitor. You could even keep it open all the time in its own desktop space, so that you can see at a glance what your Mac is really doing!
Before you go
After spending over 20 years working with Macs, both old and new, theres a tool I think would be useful to every Mac owner who is experiencing performance issues.
CleanMyMac is highest rated all-round cleaning app for the Mac, it can quickly diagnose and solve a whole plethora of common (but sometimes tedious to fix) issues at the click of a button. It also just happens to resolve many of the issues covered in the speed up section of this site, so Download CleanMyMac to get your Mac back up to speed today.


if my I-mac is running slow at start up how can i clean it out or defrag it or whatever i can do to make it run better it is fairly new I have only cleaned out history but any help would helpme…thanks